Understanding office rent benchmarks and market basics
Core definitions and key terms
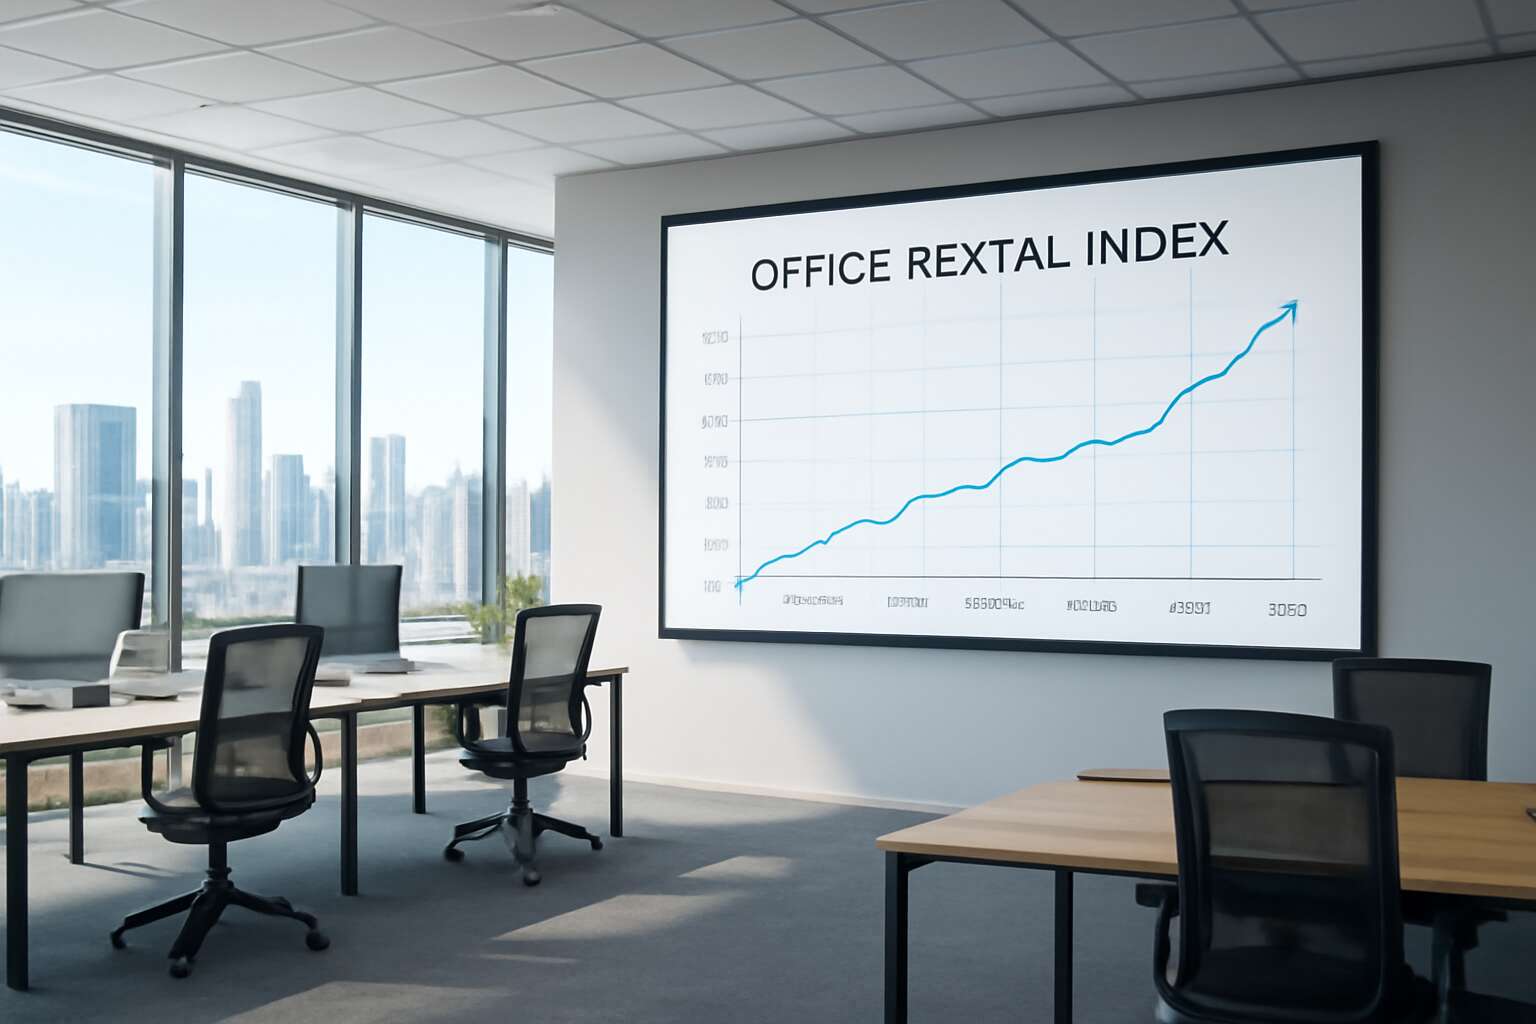
Rents shift like city lights—fast and often surprisingly precise. The office rental index acts as a weather vane for business space, signaling rents across South Africa’s CBDs and suburbs. “Clarity is the first currency of negotiation,” a seasoned broker observes, and that clarity comes from reading market signals rather than guesswork.
To orient yourself, focus on these core definitions and key terms:
- Lettable area (GLA) vs usable floor space
- Gross rent vs net rent
- Vacancy rate and absorption
- Cap rate and yield
In South Africa, the office rental index weaves these elements with local realities—transit links, precinct quality, and institutional landlords—revealing the true price signals behind every lease. When brokers, tenants, and owners speak the same language, the market moves with greater trust and predictability!
What the index measures in the office market
Rents in South Africa’s commercial heart beat with surprising tempo—one quarter can tilt the balance of a decision. A veteran broker once said, ‘markets reveal themselves in the quiet signals between deals.’ I’ve learned to read those signals when I translate data into clear expectations for tenants and owners.
Across South Africa, the office rental index distills a market into readable numbers: regional variations, price drift, and the pace at which space is being taken up or left idle. It taps into transit links, precinct quality, and the influence of institutional landlords, turning complexity into a navigable forecast.
Three moving parts feed the index:
- lease activity and new deals across CBDs and suburbs
- supply dynamics and new developments at transit-rich precincts
- tenant demand patterns by sector and space type
How benchmarks are calculated and standardized
A single rent figure rarely captures the pulse of South Africa’s office scene; benchmarks are the frame that holds the drama still enough to study, yet elastic enough to breathe with quarterly shifts. I read the data the way a map reader studies coastlines—carefully, respectfully. In practice, benchmarks are built from observed leases, renewals, and incentives, then cleaned and time-adjusted so apples meet apples across CBDs and suburbs. Rents are stripped of one-off concessions, space quality is normalized, and term lengths are aligned so you can see real drift rather than noise. The result is the office rental index that guides tenants and owners toward clearer expectations, not hollow predictions.
In practice, standardization means the same lens across markets: class, location, space type, and term length all feed into a comparable signal so decisions aren’t skewed by quirks in one corridor. It’s not fortune-telling; it’s disciplined discernment, a way to translate data into expectations that hold under pressure.
Why benchmarks matter for tenants, landlords, and investors
“Rents require courage to read,” says a market veteran, and the office rental index is the compass that steadies the gaze. It distills noisy leases into a coherent rhythm, so tenants can hear the true tempo behind quarterly shifts.
Understanding the basics means I see how location, class, space type, and term length shape value. The index levels these fields so comparisons aren’t skewed by anomalies in any corridor; it is a lens that reveals drift, not drama.
Here’s who benefits from that clarity:
- Tenants gain budgeting clarity and planning confidence
- Landlords price incentives and manage risk with steadier revenue
- Investors assess risk-adjusted returns across markets
In South Africa’s vibrant markets, the index remains a living metric, weaving space, value, and expectation into one narrative you can trust as the skyline changes.
Global vs local benchmarks and when to use each
“Benchmarks don’t lie; they speak in quarterly rhythms,” a South African broker once reminded readers. Understanding office rent benchmarks means knowing when to read global currents and when to trust local footprints. Global benchmarks shine when sketching a market’s across-the-board health or comparing office rents on an international stage, while the local variant—anchored in specific corridors and building classes—draws the line between a headline rate and a fair deal. The office rental index acts as a harmoniser, translating wide swaths of data into a readable tempo.
- Global benchmarks: cross-market comparisons, macro trends, and portfolio-level decisions.
- Local benchmarks: corridor dynamics, class and space-type nuances, and negotiated terms.
- When to use each: strategic planning, risk assessment, and budgeting cycles that align with quarterly shifts.
In South Africa, this layered approach keeps pace with a skyline constantly evolving, from Gauteng hubs to coastal capitals.
How rental indices are constructed for office spaces
Data sources and scope
Rents don’t travel in straight lines; they drift like weather across South Africa’s office towns. The office rental index translates that weather into a readable forecast, pulling rents and vacancies from diverse markets into one dependable measure. It reflects submarkets, building classes, and seasonality so space tells its own story, not just a single deal.
Key inputs come from several established channels that stay current with market shifts:
- Property management and leasing databases
- Broker and agency surveys capturing negotiated rents
- Public records and transaction data for spaces changed hands
- Submarket classifications and property-type adjustments
The scope spans major metros and growth corridors, from CBDs to suburban campuses, while honoring local quirks. Thus, the office rental index acts as a reliable mirror and compass for South Africa’s property decisions.
Frequency, revisions, and backfilling
Constructing a robust office rental index in South Africa is a careful craft, balancing numbers with story. Data arrives through rolling updates—monthly or quarterly—keeping the picture honest and timely. Frequency shapes the relevance of the index more than any single deal ever could.
Three rhythms keep it honest:
- Frequency of data collection: monthly or quarterly, so shifts in rent and vacancy are captured with enough texture.
- Revisions: retrospective adjustments when late closes or revised rents alter the picture.
- Backfilling: using nearby markets and time-series smoothing to fill gaps in sparse datasets.
Backfilling and revisions are paired rituals, ensuring the office rental index mirrors real market movement while remaining methodical and auditable. The aim is a forecast that speaks softly to local quirks and bold market turns alike.
Regional vs global methodologies
Rents drift like constellations across a city’s skyline, and a precise office rental index is the telescope that makes sense of the glitter. In South Africa’s markets, construction begins with a regional conscience—Cape Town’s lease cadence, Johannesburg’s demand surges, and the quiet hum of smaller towns—each telling a distinct chapter. The craft is to stitch these chapters into a coherent signal, not a blur of averages.
Regional methodologies honor local drivers—submarket velocity, lease lengths, and space class—while global benchmarks offer a steady frame for cross-market comparison. Each approach serves a purpose: regional models sharpen local decisions; global benchmarks anchor the market in a shared language that transcends borders.
- Regional: strong sensitivity to local quirks and cycle timing.
- Global: consistency, governance, and wider peer comparability.
Currency, size, and normalization adjustments
Rents drift like constellations, but the office rental index is the telescope that makes sense of the glitter. In South Africa, Cape Town, Johannesburg, and the smaller towns each hum with a rhythm, so the index must be built from a regional lens rather than a single national throw.
Currency, size, and normalization are the bones of construction. The main inputs include:
- Currency alignment in Rand terms to keep comparisons stable across time!
- Size normalization to a standard unit, typically per 1,000 square metres
- Normalization adjustments for lease type, fit-out level, and service charges
When these pieces align, the index stays useful across markets and cycles—clear, comparable, and steady for tenants, landlords, and investors.
Interpreting index movements and signals
Identifying uptrends vs downtrends
Brace yourselves—the office rental index just clocked a 3.2% quarterly swing, a move sharp enough to wake even the most caffeinated lease negotiator. It reads like a pulse: demand rising where spaces are scarce, and vacancy playing peek-a-boo in slower corners. The data doesn’t lie.
Interpreting these moves means separating uptrends from downtrends. When the office rental index climbs with rising occupancy and rents, the uptrend is real; when it falters, signals of a pause appear. Look for momentum, persistence, and occasional divergence between rents and vacancies.
- Consecutive monthly gains imply momentum
- Higher highs and higher lows confirm an uptrend
- A stall or breach of longer-term averages hints at a trend shift
For a South African audience, these signals gain local texture—urban corridors, sector shifts, and currency quirks tint the read of the office rental index. The result is a more vivid market narrative, without chasing every headline.
Understanding volatility and confidence intervals
The office rental index is not a fortune cookie—it’s a pulse. This quarter it swung roughly 2.1%, a move that could wake even the most caffeine-fueled lease negotiator. When rents climb with rising occupancy, you’re spotting a real updraft; when data jitters appear, expect a pause or pullback. Reading it means weighing momentum, persistence, and the odd divergence between rents and vacancies.
To frame volatility and confidence, consider these signals:
- Volatility widens when market nerves rumble.
- Confidence intervals expand with revisions and new data.
- Convergence between rents and vacancies strengthens the signal.
South Africa-specific realities—rand volatility, corridor-specific demand, and sector shifts—shape how wide those intervals feel. It becomes a practical map, not a crystal ball: it helps you gauge risk, time leases with a touch of swagger, and separate signal from noise without chasing every headline.
Correlating index moves with market drivers
Movements in the office rental index rarely feel random; they mirror the tempo of tenants, lenders, and the stubborn pulse of rand volatility across South Africa’s metro corridors. When the index climbs, new leases often crystallize; when it falters, caution tempers appetite.
Interpreting the signals hinges on momentum and the dance between rents and vacancies. A brisk uptick points to demand outpacing supply; a gentle drift signals pause, adjusted by incentives and lender nerves.
- CBD versus suburban corridor dynamics
- Seasonal leasing cycles and new-build completions
- Incentives, concessions, and tenant mix
- Rand volatility and cross-border capital flow
Common misinterpretations and cautions
A single tick in the office rental index can redraw the lease map faster than a market whisper travels. It isn’t a fortune-teller’s crystal ball, but a compass that places momentum, rents, and vacancies into sharp relief for South Africa’s markets.
Interpreting the signals hinges on reading tempo rather than chasing absolutes. A brisk uptick often signals demand nudging out supply; a slow drift invites caution and a deeper look at incentives and lender nerves, and I watch the rand’s sway across metro corridors to gauge realism in the move.
Common misinterpretations and cautions:
- Assuming every uptick signals a lasting boom; some volatility hides seasonality or one-off deals.
- Equating rent increases with tightening fundamentals without weighing vacancies or incentives.
- Ignoring currency effects and cross-border capital that twist local movements in the office rental index.
- Neglecting reporting lags that blur when the index actually moves.
These readings remind readers to treat the office rental index as a compass, guiding decisions without pretending to predict every twist in the rand and market.
Practical applications for tenants and operators
Budgeting and scenario planning
South Africa’s office markets pulse with possibility, and a single reading from the office rental index can tilt a year’s plans. In our landscape, a 1% rent move can tilt an entire year’s occupancy cost, nudging tenants toward renewal or exploring alternatives.
Practical applications for tenants and operators are both precise and poetic. Budgeting and scenario planning become a craft: consider these themes woven into your process.
- Understanding renewal terms and rent escalations and their effect on long-term occupancy costs
- Assessing vacancy risk and re-letting timelines to gauge liquidity under stress
- Weighing owned versus leased space to compare long-term affordability in shifting markets
A nimble mindset makes numbers glow, turning data into strategy as markets sway and stakeholders listen.
Lease negotiation leverage and timing
One percent swing in rent can tilt a year’s occupancy cost, a gravity well shaping SA’s office markets. The office rental index is not merely a snapshot; it’s a living forecast that guides renewal timing and space planning. In practical terms, it becomes leverage and timing—an almost ceremonial guide through negotiations charged with ambition and risk.
Practical levers emerge when the index moves. Consider these index-informed considerations:
- Index-informed negotiation leverage—anchor rent and terms to observed movements, inviting flexibility rather than rigidity
- Strategic timing—align discussions with subtle shifts in the index to surface concessions in context
- Portfolio alignment—evaluate how space choices mirror long‑term affordability as market signals evolve
In the end, the office rental index turns data into dialogue, guiding how people relate to space and time, sharpening judgment as market sentiment shifts.
Portfolio analytics and site selection
A single turn in the office rental index can tilt a year’s occupancy cost, turning space into a ledger of ambition and risk. In South Africa, the index is not merely numbers; it’s a living forecast shaping renewal timing and portfolio posture.
Tenants use the index to map total occupancy costs across a portfolio, stress-test scenarios, and plan capex with confidence. For operators, it becomes a lens into demand, occupancy planning, and risk management. I’ve seen teams leverage index trajectories to calibrate lease maturities and renewal timing, improving outcomes while preserving flexibility. When choosing sites, the index informs which suburbs or business districts are likely to tighten or loosen, helping to align real estate with strategic growth.
- Portfolio analytics: track cost concentration and renewal risk in real time.
- Site selection: compare micro-markets by index momentum and supply signals.
- Forecast-informed budgeting: stress index scenarios to plan long-term affordability.
Benchmarking vacancy, rents, and incentives
Across South Africa, the office rental index moves like a weather pattern—subtle shifts can tilt an entire year’s occupancy cost. For tenants, it provides a compass for evaluating vacancy patterns, rent levels, and concession packages across portfolios. For operators, it functions as a lens on demand and renewal risk, guiding leasing tempo in the right suburbs and districts.
- Assess vacancy trends and absorption to gauge space effectiveness
- Compare rent levels and incentive packages across micro-markets
- Track lease velocity and term mix to understand demand dynamics
The index translates market signals into a shared narrative that informs forecasting-informed budgeting and long-range planning, keeping affordability aligned with growth. It weaves together macro shifts and local quirks, anchoring decisions in data while honoring the human scale of place and purpose in South Africa’s vibrant office districts.
Communicating insights to stakeholders
South Africa’s office markets pulse with a stubborn reminder: a small vacancy swing can rewrite a year of occupancy costs. The office rental index turns that tremor into a tangible map for tenants and operators alike, translating volatile signals into decisions about space, timing, and growth.
- Benchmark current space against micro-market rent levels.
- Assess incentives to optimise total occupancy cost.
- Gauge renewal risk to inform portfolio strategy.
Operators read absorption, leasing velocity, and renewal risk to tune tempo, tilt portfolio exposure, and target the right suburbs. Communicating these signals to executives builds a shared narrative that anchors budgeting in reality.
The office rental index becomes a common language—between landlords, tenants, and investors—fostering clarity in growth and affordability across South Africa’s vibrant districts.
Case studies and regional benchmarks
Case study: a large metro market snapshot
In South Africa’s largest metros, the office rental index reads like a weather map for business sentiment. As one veteran market watcher puts it, “space follows where plans are funded.” The case study of a large metro snapshot shows prime corridors holding value even as peripheral areas cool, underscoring how incentives shift in a post-pandemic, hybrid world.
Johannesburg’s Sandton corridor remains magnet for finance and tech tenants, while the CBD softens. Cape Town’s coastal nodes see steadier occupancy with new mixed-use development; Durban’s gateway markets lean into logistics-focused space. The snapshot under regional benchmarks reveals a pattern: value accrues where business services cluster and access to transport improves.
Case study: a growing secondary city
From the vantage of a growing secondary city, the office rental index feels like a weather vane for a country reimagining its workweek. The city’s transformation hinges on old warehouses catching new light, while start-ups and logistics players fill the gaps between rail yards and riverfronts. I’ve seen the index move with quiet charisma, tracing a map where investment travels first, then space follows.
Even in these pockets, the rhythm is uneven, yet instructive. Where a university district meets a light industrial belt, occupancy rises and rents hold steadier than in ritual metros. The secondary city demonstrates how flexible space and transit access can anchor resilient submarkets, and the office rental index reflects that story in real time.
Regional benchmarks, when read together, reveal a pattern: value accrues where knowledge workers cluster and transport lines thread the city to global gateways. I watch as the office rental index reveals new offices popping along redevelopment streets, shaped by appetite and patience.
Case study: impact of supply additions
Case studies across South Africa’s growing secondary cities reveal a telling arc: a 4% uptick in new office stock last year nudged the office rental index upward, even as gains arrived in waves. In corridors where warehouses shed rust for glass, creative hubs awaken; in rail-adjacent belts, logistics campuses steady occupancy and rents. The narrative unfolds with quiet, luminous momentum, showing how supply additions spark exploration before demand catches up.
- Redevelopment of former warehouses into flexible offices
- New logistics hubs with coworking and light manufacturing
- Transit-oriented developments linking suburbs to CBD gateways
Regional benchmarks echo that pattern: submarkets thrive when supply aligns with transport arteries and knowledge workers cluster near them. Where appetite meets patience, the index becomes a map of resilience, tracing how districts rise on light rails, bike lanes, and the glow of incubators.
Case study: cross-border office markets
Cross-border office markets in Southern Africa bend light into shape, and the office rental index is the compass that traces the journey. Last year, occupancy in key corridors nudged upward as regional supply realigned with talent pools, turning whispers of demand into tangible momentum. Where warehouses shed their rust for glass, flex spaces woke up alongside logistics campuses, threading a corridor of growth from Durban to Lusaka and back to Johannesburg. The tale feels patient and luminous: a small uptick today invites curiosity tomorrow.
- Border-region incentives and streamlined permitting attract multinational tenants
- Rail and port connectivity foster mixed-use campuses near gateways
- Urban regeneration projects create flexible leases that adapt to seasonal demand
Regional benchmarks echo that pattern: when transport arteries pulse and knowledge workers cluster near them, districts rise with a quiet, sustainable glow. In this cross-border context, the index becomes less a number and more a map of opportunity, inviting tenants and investors to trace their next horizon. The office rental index remains a trusted compass.
Extracting learnings and best practices
A 6% uptick in occupancy across Durban-to-Johannesburg corridors last year wasn’t loud, but it spoke volumes about how cross-border patterns are reshaping demand. In this evolving mosaic, the office rental index acts as a compass, tracing how spaces—from flexible hubs to logistics campuses—shift from whispers to momentum.
From case studies and regional benchmarks, several learnings stand out:
- Match new office supply with nearby talent pools and transit corridors to minimize idle space.
- Leverage cross-border policy incentives and faster permitting to entice multinational tenants.
- Offer flexible leases within mixed-use campuses to absorb seasonal demand.
- Invest in rail, port, and gateway connectivity to anchor knowledge corridors.
When transport arteries pulse, regional benchmarks glow with quiet sustainability, and the office rental index maps those opportunities for tenants and investors alike.




0 Comments